Fig.
1 - The distribution between places, all three cities.
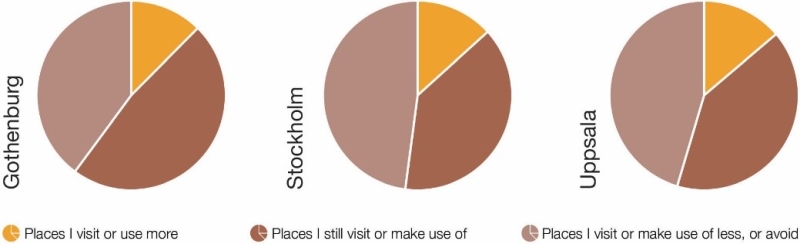
Fig.
2 - The distribution of uses.
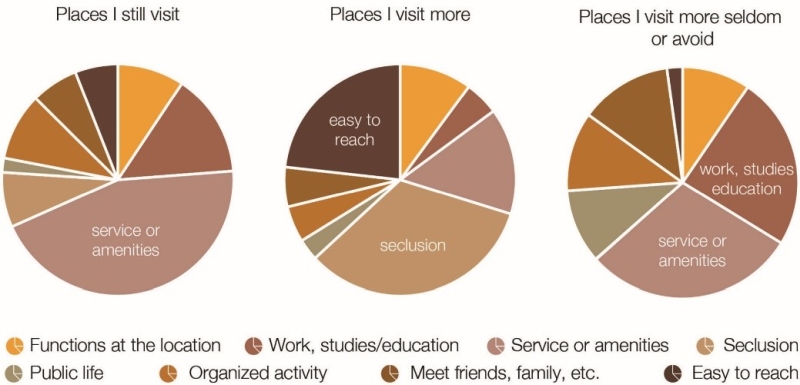
Fig.
3 - The distribution of uses.
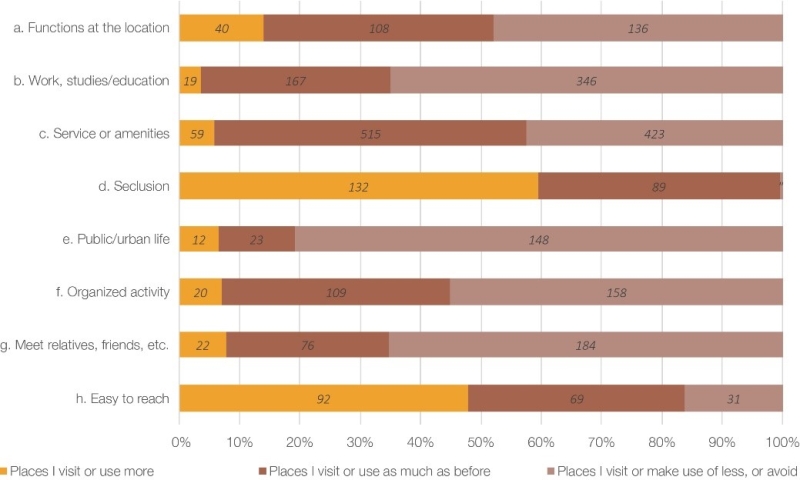
Fig.
4 - Places avoided, where those related to work/study, are marked in black.
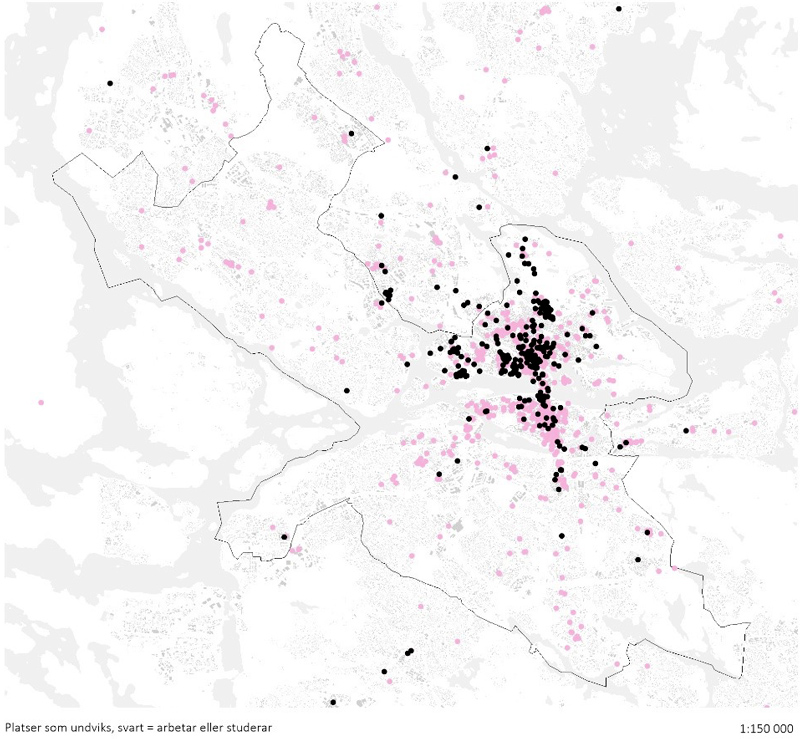
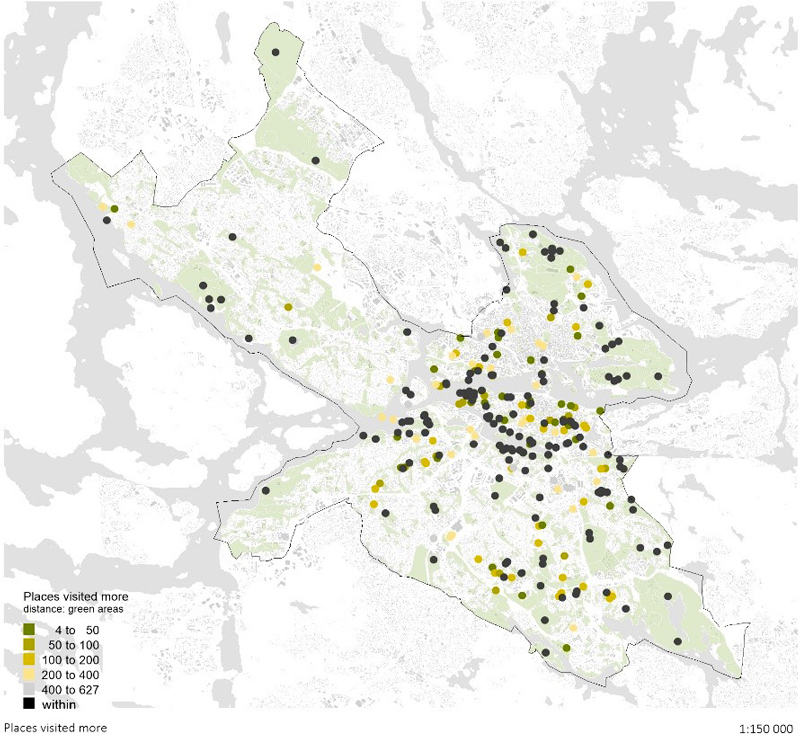
Fig.
5 - Places visited more and their relation to parks and nature